Results
In this part, you can explore the final results of our analysis. The results is divided into 3 parts, The first part is a spatio-temporal analysis of air pollution, the second part is an exploration of spatial patterns of air pollution and population exposure, and the third part is a time series analysis and potential source analysis.
1. Spatio-temporal analysis of air pollution
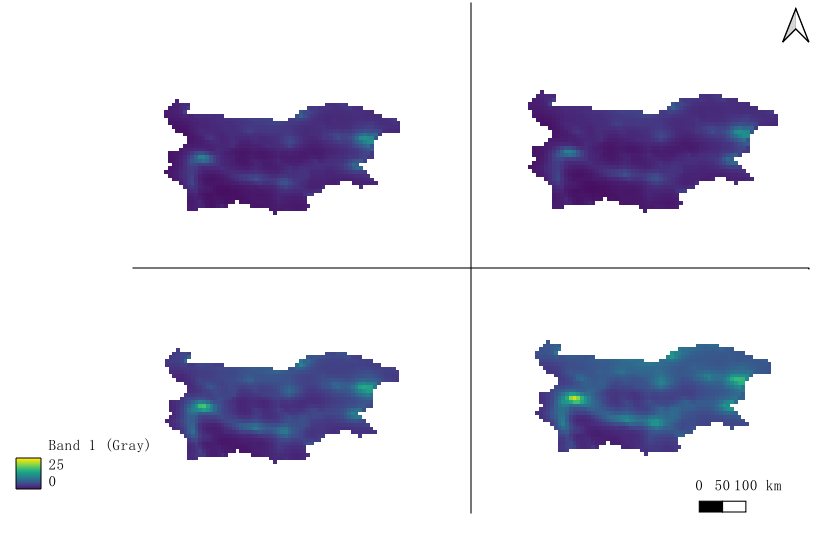
First we calculated the annual mean for each pollutant and analyzed the Annual Average Difference from 5-year Mean and the ten-year seasonal aggregation, and found that the pollution in Bulgaria reached a ten-year peak in 16 years, and has decreased in recent years. It shows a seasonal distribution pattern, with lighter pollution in summer and the most severe air pollution in winter.
Secondly, it also has certain characteristics in space, where the distribution of pollutants is concentrated in polycentric form, radiating outward around major metropolitan areas.
We therefore considered focusing on December of the calendar year in our subsequent time-series analysis.
2. Exploration of spatial patterns of air pollution and population exposure
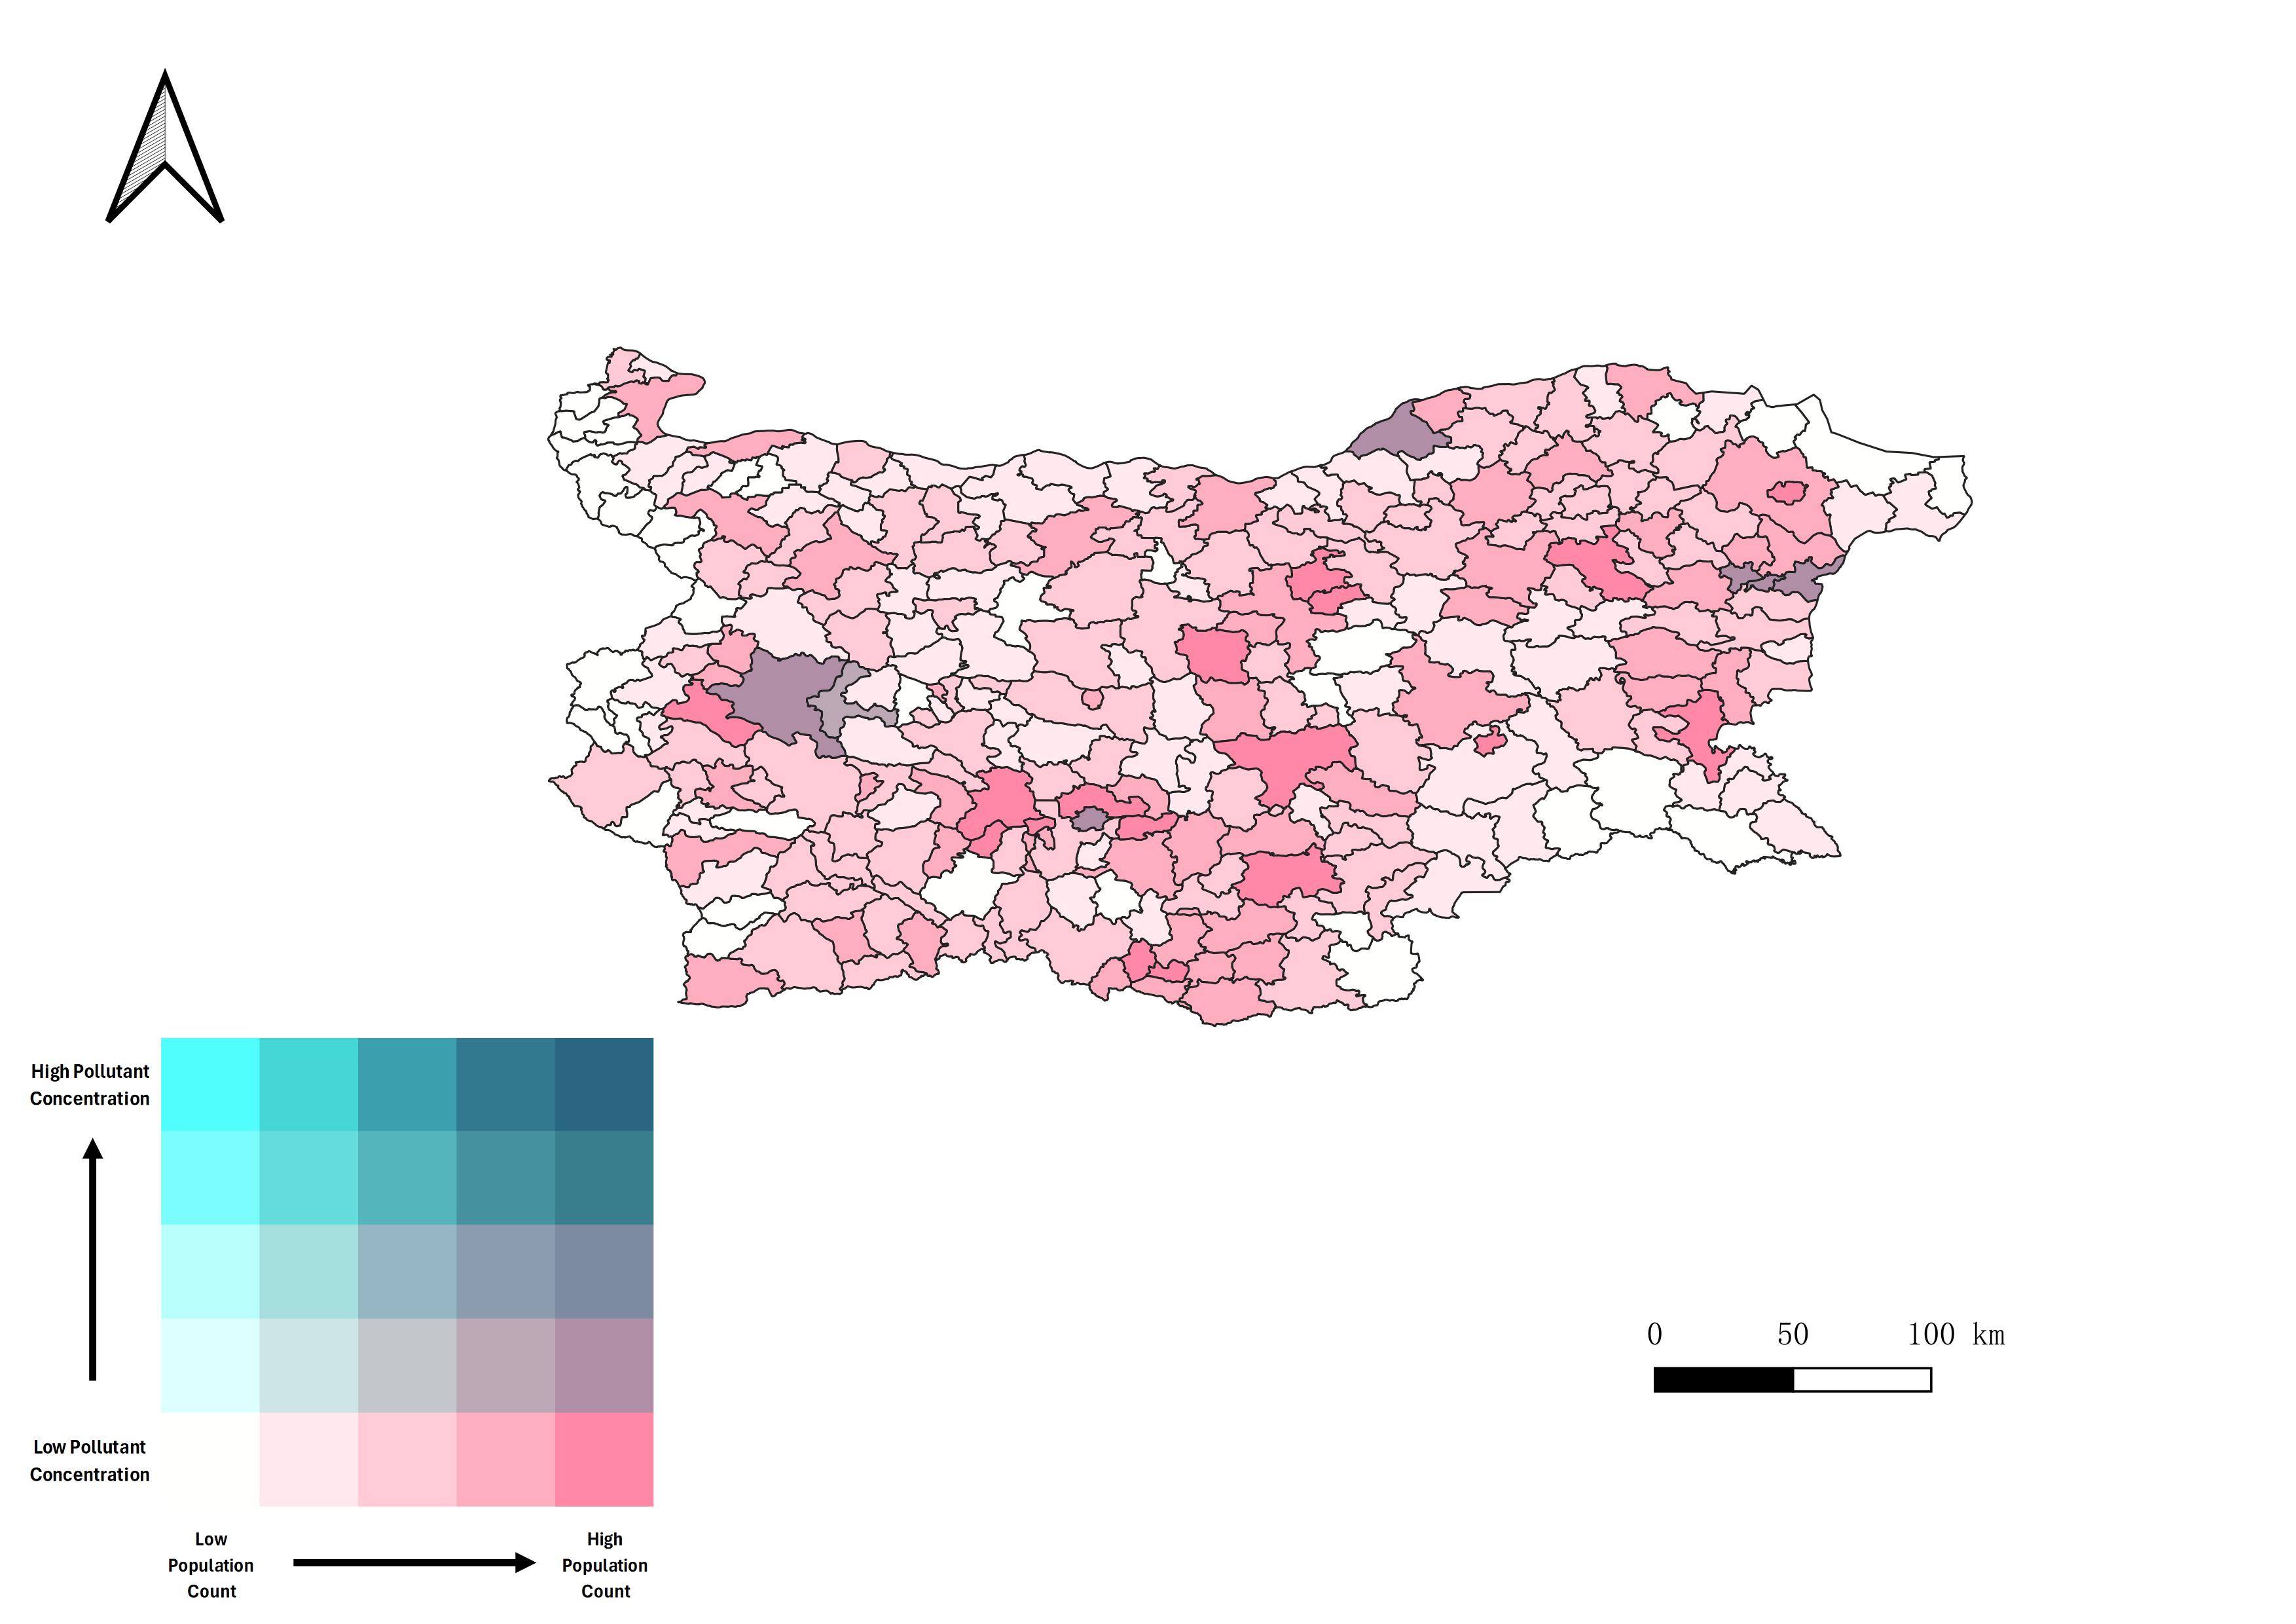
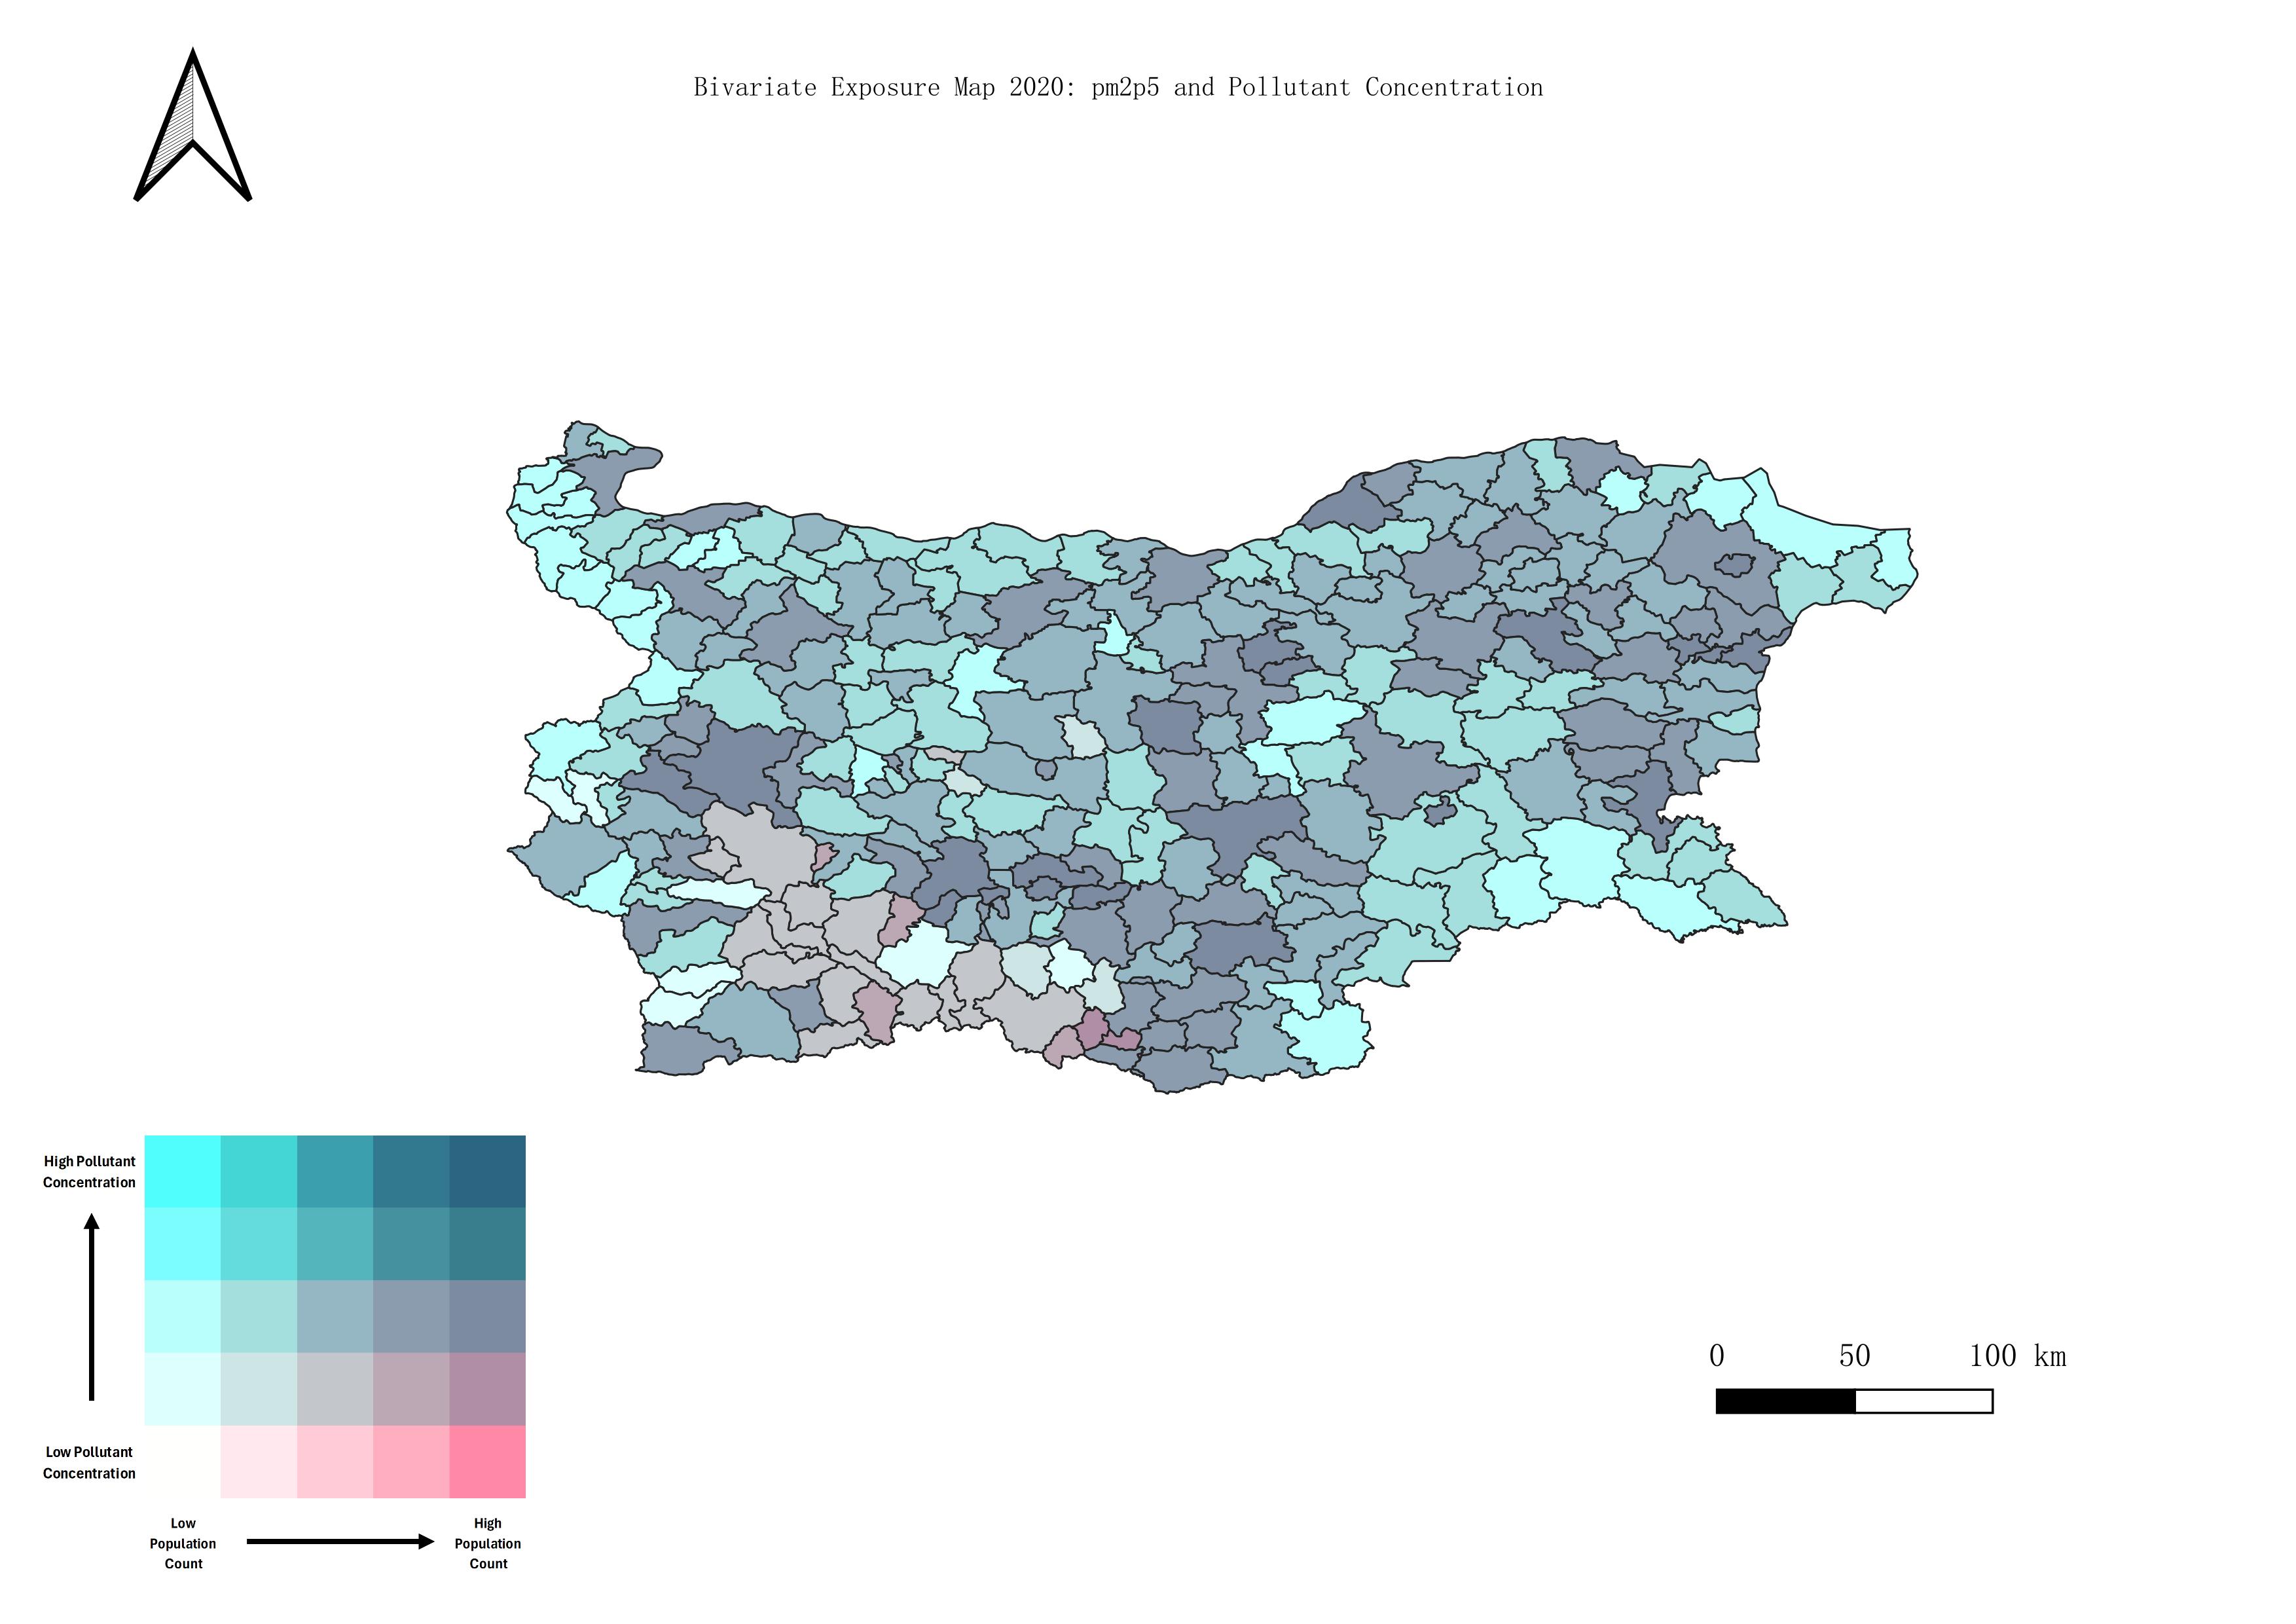
Based on the bivariate maps of pollutants, we can well reveal their spatial patterns, especially the degree of their air pollution is somewhat positively correlated with human economic activities. Sofia, the capital region of Bulgaria, is a highly polluted and densely populated area.
To better quantify the actual impact of pollution on the population, we generated pie charts based on the bivariate map classifications
According to the NO2 pie chart, the overall NO2 situation is good, with about 67.9% of the population exposed to the lowest pollution level (Level 1) and 32.1% at Level 2. This indicates that the majority of the population is exposed to relatively low levels of NO₂ and that areas of high concentrations are confined to limited areas.
According to the PM2.5 pie chart, the overall PM2.5 situation is poor with only 4.66% of the population exposed to level 2 pollution and 95.3% at level 3. This indicates that the majority of the population has a relatively high level of exposure to PM2.5, and the overall situation of aerosol pollution is critical.
3. Explore Analytics
Potential source analysis
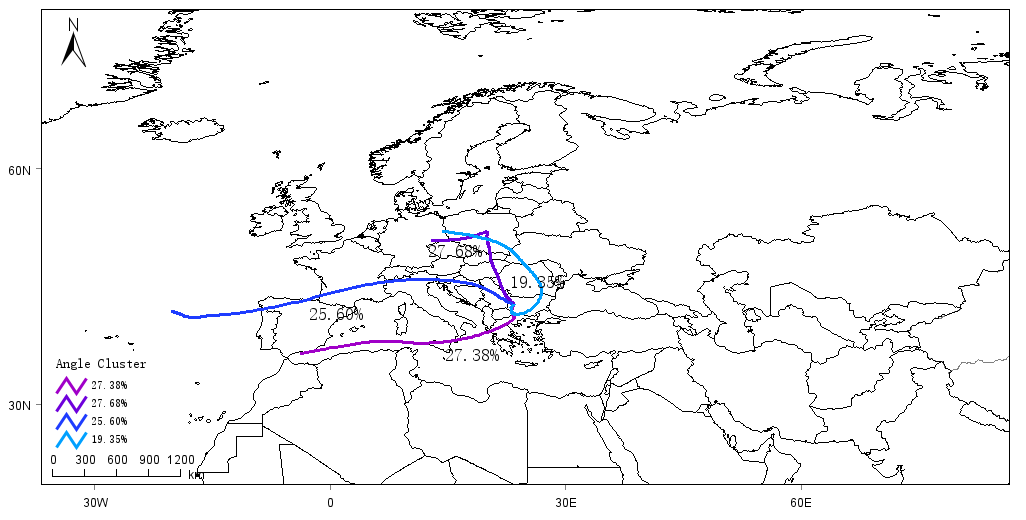
The analysis shows the results of clustering of the source paths of air masses based on Sofia (the capital of Bulgaria) as a receiving point, calculated by backward trajectory analysis of multiyear meteorological data (e.g., possibly using the HYSPLIT model). The different colored curves represent different Angle Clusters, where each type of path indicates the typical direction of air mass transport from the source region to Sofia and its probability of occurrence on a given time scale.
Time series analysis
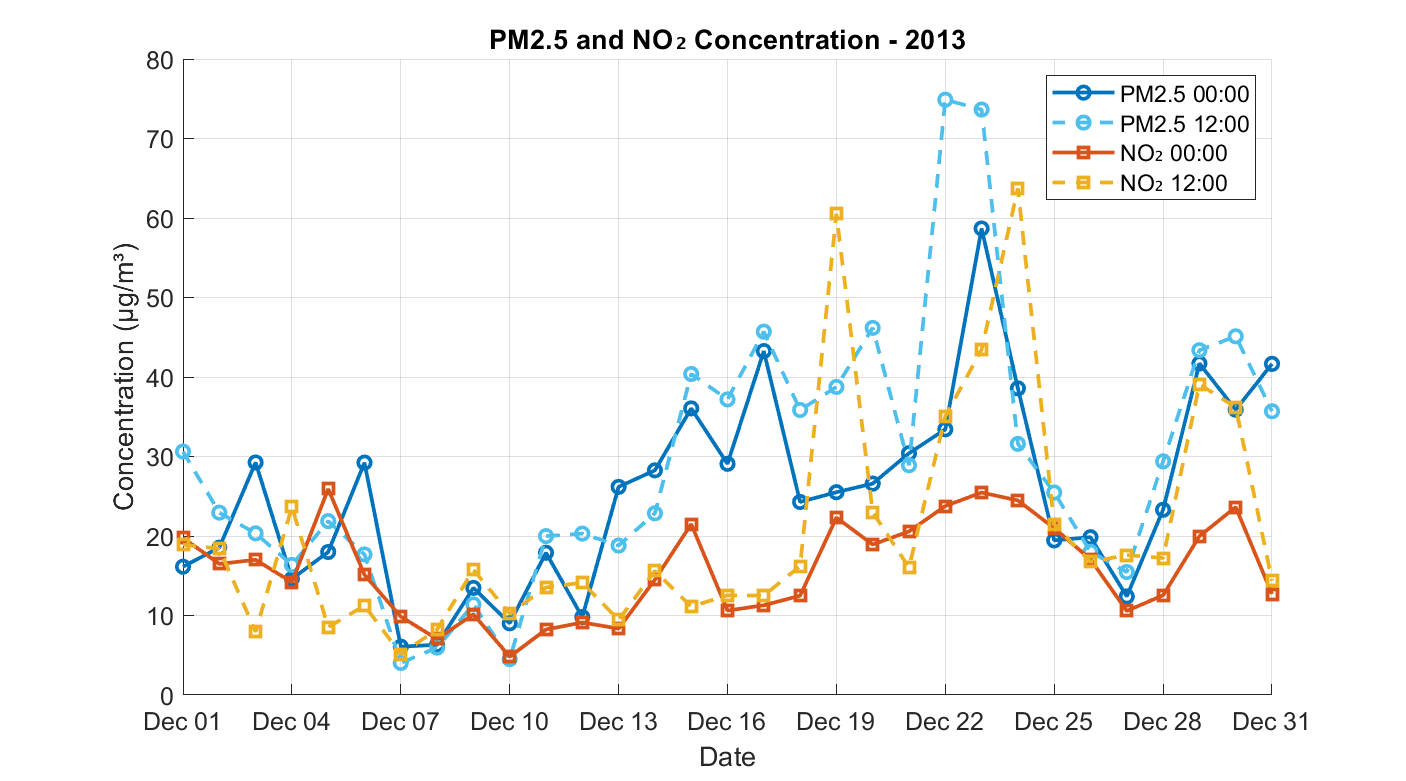
The analysis shows that the air pollution distribution in Bulgaria possesses a temporal pattern, so the month of December was used as an example to dig deeper into the temporal changes over the past 10 years. Over the period from 2013 to 2022, both PM2.5 and NO₂ concentrations in December revealed recurring pollution episodes, with variability in magnitude and timing across years.